
How to read a PSX stock page: RSI, moving averages, support and the 52-week range
Every company page on this site shows the same set of numbers. This guide explains what each one measures, what it is good for, and where it misleads, so you can read a page in a minute instead of guessing.
Every company on the exchange has a page here, built from the same data and laid out the same way. Once you can read one, you can read all 400 of them. This guide walks down a page from top to bottom using Pakistan Petroleum as the example, and is honest about which numbers deserve weight.
The header
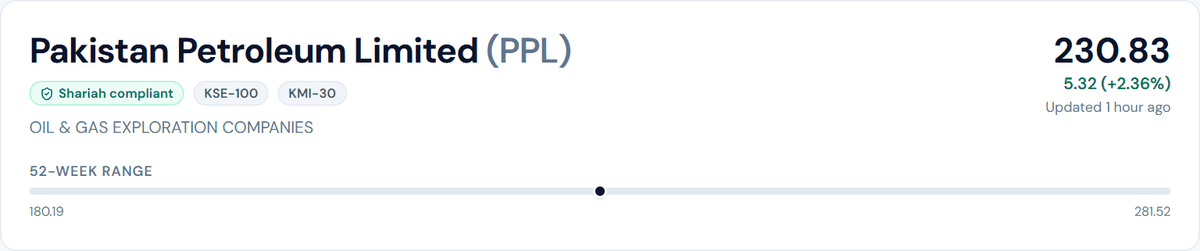
Name, ticker, three badges, sector, price, and where the price sits in its yearly range.
Badges. Shariah compliant means the company is a constituent of the KMI All Shares Islamic Index; Not KMI listed means it is not. KSE-100 and KMI-30 mark membership of those indices, which say something about size, not compliance. The index guide explains the difference.
Price and change. The latest price the exchange's data portal has published, with the day's move in rupees and percent. "Updated 16 hours ago" during market hours means the portal has not refreshed; the number is the last close, not a live tick. Nothing on this site is fast enough for intraday trading, and it does not try to be.
52-week range. A bar from the lowest to the highest price of the past year, with a marker at today's price. A marker at the far right means the stock is at a yearly high, which is either strength or exhaustion depending on everything else. Near the left, either value or a falling knife. The bar tells you where you are, not which of those it is.
Under the header, one sentence answers the Shariah question directly, sourced from the index list. The guide to checking compliance covers what that sentence does and does not mean.
AI analysis
A short note with a headline, an overview, a bull case and a bear case, refreshed on a schedule. It is generated by a language model from the numbers on this page and recent announcements. It is useful as a summary of what the numbers say; it is not a source of new information, and it can misread a situation. Read it after the numbers, not instead of them.
The three cards
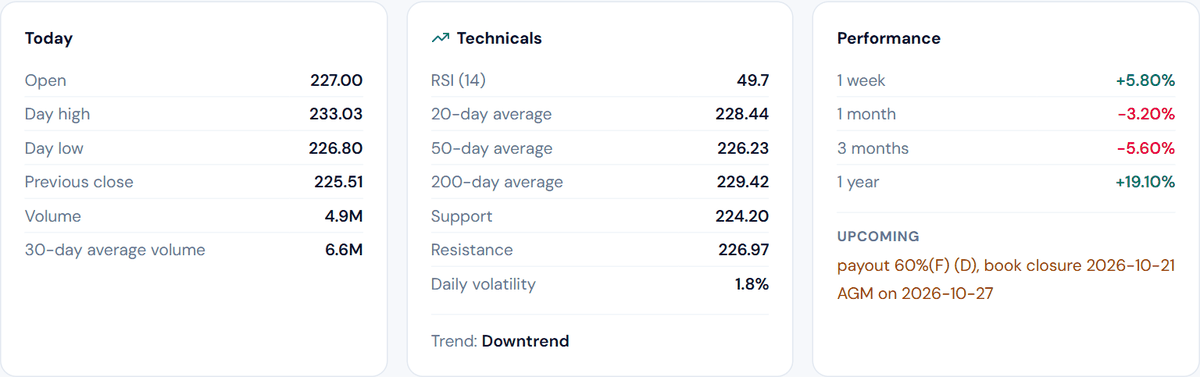
Left to right: what happened today, where the price sits technically, and how it has done over time.
Today
Open, day high, day low, previous close, volume, and the 30-day average volume. The one worth a habit is volume against its average. A price move on double the usual volume was driven by real participation; the same move on a quarter of the usual volume was two people agreeing. On the PSX, where many listed companies trade thinly, this distinction matters more than it does in larger markets.
Technicals
RSI (14). The Relative Strength Index compares the size of recent gains to recent losses over 14 trading days and scales the result from 0 to 100. Above 70 is conventionally "overbought", below 30 "oversold". Treat those as descriptions of momentum, not predictions. A stock can stay above 70 for weeks in a strong trend. RSI is most useful at extremes and when it disagrees with price: a new price high on a lower RSI reading than the last high is momentum fading.
20, 50 and 200-day averages. The average closing price over each window. Price above all three, with the shorter averages above the longer ones, is the textbook uptrend; the reverse is the textbook downtrend. The 200-day is the slow one that institutions watch; a stock crossing it in either direction tends to get noticed. The Trend line at the bottom of the card summarises this arrangement in one word.
Support and resistance. Recent price levels where the stock has repeatedly stopped falling (support) or stopped rising (resistance). They are computed from daily closing prices as swing levels, so they are approximate, and intraday prices can move through them briefly. Use them as reference points for where a move might pause, not as lines that cannot be crossed.
Daily volatility. The typical size of a one-day move, in percent. A stock with 1.8 percent daily volatility routinely moves that much; a 4 percent day is unusual for it. For a stock at 4 percent volatility, the same 4 percent day is Tuesday. Position sizes should shrink as this number grows.
Performance
The percentage change over one week, one month, three months and one year, followed by Upcoming: any announced dividend with its book closure dates, and any scheduled meeting. The dividend guide explains how to read "payout 60% (F) (D)", and the ticker suffix guide explains what happens to the price when the book closure arrives.
Peers and picks
Near the bottom, other companies in the same sector with their day's move, so that "is it just this stock or the whole sector?" can be answered without leaving the page. A link to the Shariah-compliant picks for that sector follows, when the sector has a picks page.
A one-minute reading order
- Badges. Compliant or not; large or not.
- Range bar. Near a yearly high, a yearly low, or the middle.
- Trend line. Uptrend, downtrend or sideways.
- Volume against average. Is anyone actually trading it?
- Upcoming. Is there a dividend or meeting about to move the price?
- AI note. Does the summary match what you just read? If not, trust the numbers.
That order works because it goes from facts that do not change (compliance, size) to facts that change daily (volume, events), and puts the generated text last.
What the page cannot tell you
The analysis here is technical: prices, volumes and averages. The page does not read financial statements, model earnings, or know that a company is about to lose its largest customer. It cannot tell you whether a price is cheap relative to the business, only relative to its own history. For a company you are seriously considering, the annual report on the PSX website is the next stop, and this page is the place to check the price action once you have read it.
Keep reading
SmartSarmaya is an educational research tool, not a licensed financial adviser and not a source of religious rulings. Shariah status reflects membership of the KMI All Shares Islamic Index published by the Pakistan Stock Exchange. Always do your own research.